
Why my metrics are not moving?
What should I do to move the metrics?
Why users are getting stuck?
Many times the product managers get stuck at these questions. Once the metrics are setup and user activities are being tracked, the next step is to improving them
Enter Opportunity Solution Tree, giving a detailed guide on
- how to use them and track opportunity
- convert them to experiments
- move metrics
After implementing, in 10 mins you will be able to act on your product and drive outcomes by following the template.
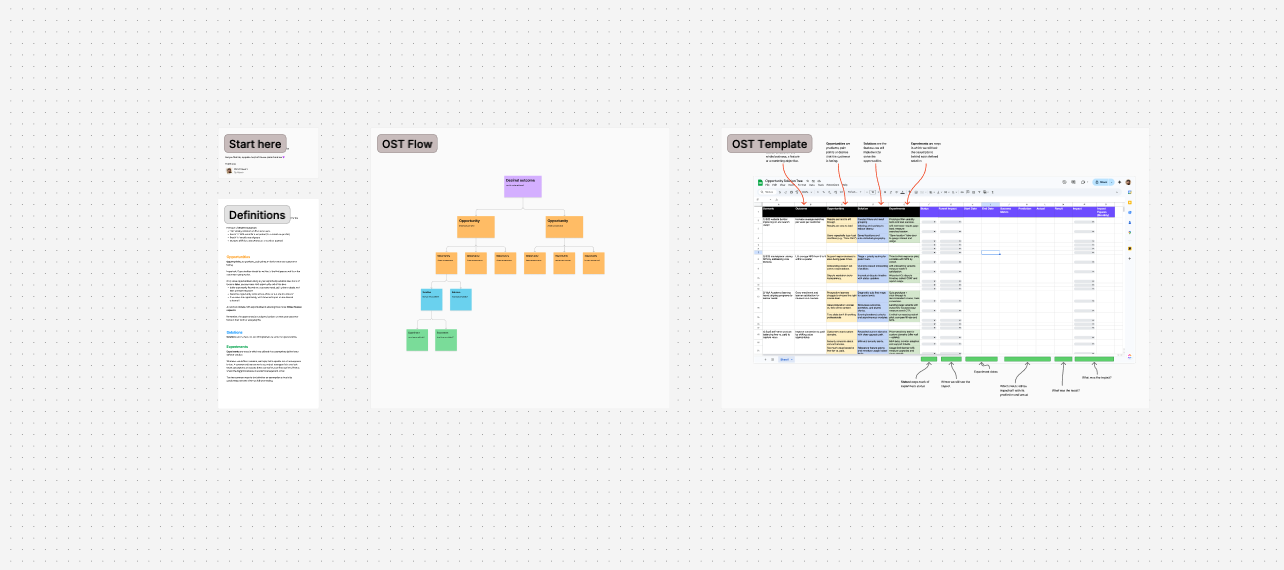
What is OST?
An Opportunity Solution Tree (OST) is a visual framework for product discovery that connects a measurable business outcome to customer opportunities (needs/pains), potential solutions, and the experiments to validate them. It helps teams align on outcomes over outputs, prioritize where to invest, and de-risk ideas through assumption testing before full delivery.
Why use an OST
- Aligns customer needs with business outcomes, improving decision quality and stakeholder alignment.
- Encourages outcome-driven discovery, not feature shipping, and accelerates validated learning cycles.
- Provides a single visual artifact to organize opportunities, ideas, and tests non-linearly as discovery evolves.
Core structure
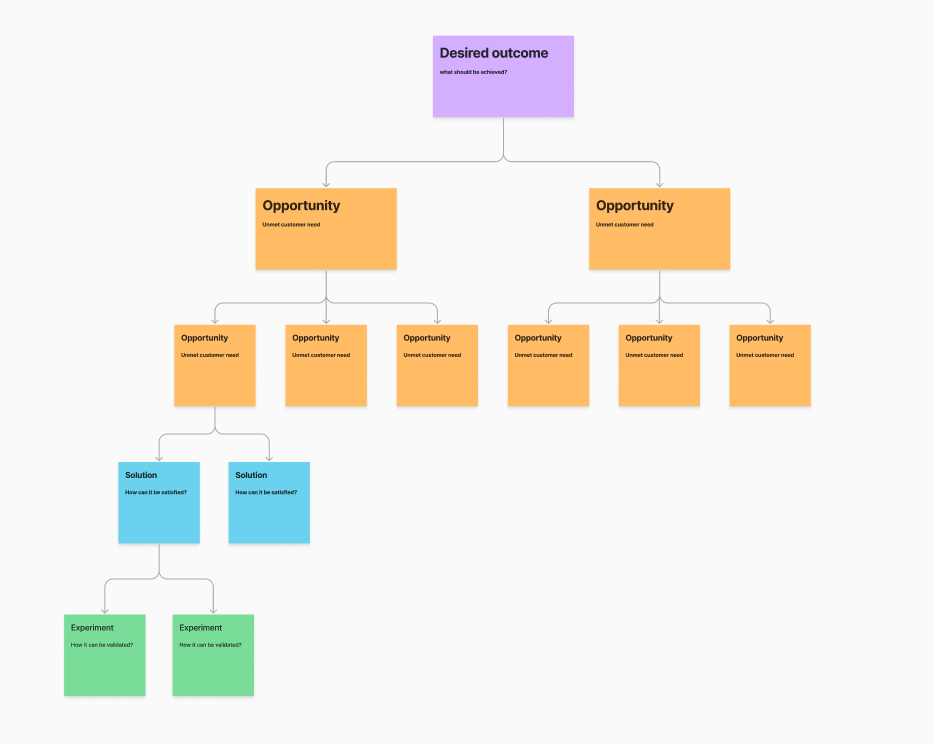
- Outcome: The clear, measurable result the team aims to move (often an OKR key result).
- Opportunities: Synthesized customer needs/pains discovered via interviews, analytics, and feedback.
- Solutions: Hypotheses/ideas to address a chosen opportunity, generated collaboratively across functions.
- Experiments/Assumption tests: Lean tests to validate riskiest assumptions and de-risk delivery.
Prerequisites (often skipped—and why not to)
- Defined target customer and value proposition.
- A clearly defined outcome/metric.
- 3–4 story-based customer interviews to populate real opportunities rather than imagined ones.
How to build one (step-by-step)
- Set the outcome
- Pick one business-relevant metric to focus discovery (e.g., activation rate, time-to-value, weekly searches/customer).
- Map the opportunity space
- From interviews, usage data, and feedback, synthesize recurring pains and jobs; cluster them into opportunity areas, not solutions
- Select a target opportunity
- Prioritize by impact on the outcome, frequency/severity, and feasibility; focus the next steps on this branch.
- Generate solution ideas
- Diverge on multiple ways to address the chosen opportunity; ensure traceability from solution to opportunity to outcome
- Identify riskiest assumptions
- For top 2–3 ideas, list desirability, usability, viability, and feasibility assumptions; pick the riskiest first.
- Run lean experiments
- Use interviews, prototypes, fake doors, concierge, and analytics-based tests to validate or invalidate assumptions fast; iterate the tree as evidence accumulates.
Tips for analytics and experimentation
- Tie each branch to a metric and instrument events upfront to quantify impact on the outcome (e.g., Mixpanel/Amplitude for adoption and retention signals).
- Use opportunity scoring or cost-of-delay to prioritize opportunity branches when resources are constrained.
- Keep the OST living: update nodes as experiments run; prune dead ends; record learnings and decisions for stakeholders.
Common pitfalls to avoid
- Jumping to solutions before mapping real customer opportunities.
- Running too many parallel outcomes in one tree—split trees per key result
- Not validating riskiest assumptions early; building before evidence.
- Treating the OST as static documentation instead of a living discovery system.
What it changes in your process
- Aligns on outcomes over outputs
- Keeps teams focused on a single, measurable goal (e.g., activation rate or trial-to-paid), so every idea and test traces back to moving that metric.
- Structures the messy middle
- Separates the opportunity space (customer pains/needs) from the solution space (ideas), preventing premature convergence on features and encouraging divergent solutioning.
- Prioritizes with evidence
- Makes it easier to compare branches by impact, frequency/severity, and feasibility, pruning weak branches and focusing resources on the highest-leverage opportunities.
- De-risks delivery via experiments
- Bakes in lean tests for riskiest assumptions (desirability, usability, viability, feasibility) before investing in full builds, reducing waste and cycle time.
- Improves stakeholder alignment
- The visual map clarifies why a solution exists (which opportunity it addresses and which metric it moves), making decisions transparent and buy-in easier.
Example (B2B self-serve product)
- Outcome: Increase week-4 activation rate.
- Opportunities: Users struggle to complete initial data integration; unclear value in onboarding; slow time-to-first-insight.
- Solutions: Guided connector setup, sample dataset auto-load, outcome-based onboarding checklist.
- Experiments: Prototype walkthrough usability test; time-to-first-chart metric; A/B checklist vs. control; track connector completion funnel.
Practical steps to apply OST (for a SaaS)
- Pick one business outcome
- Choose a metric that ties to revenue or retention
- For e.g., time-to-first-insight, week-4 activation, trial-to-paid conversion
- set a target for a defined period
- Map the opportunity space
- From interviews, support tickets, product analytics, and win/loss notes, cluster recurring pains into opportunity areas, avoiding solution language.
- Select a target opportunity
- Score opportunities on user impact and outcome leverage;
- consider feasibility and strategic fit
- pick one branch to focus next.
- Generate solution ideas
- Create multiple solution hypotheses for the chosen opportunity; keep traceability back to the outcome and opportunity.
- Identify riskiest assumptions
- List critical assumptions for each idea across desirability, usability, viability, feasibility; prioritize the riskiest first.
- Run lean experiments
- Use interviews, prototypes, fake doors, concierge tests, and instrumentation to validate assumptions; define clear success criteria tied to the outcome metric.
- Iterate and prune
- Update the tree as evidence lands;
- double down on validated branches,
- prune invalidated ones,
- and communicate changes with the visual map.
Use this template by Optiblack
Optiblack uses this template to find opportunities for companies we work with, you can use this template

What to expect once you start adopting OST?
- Faster learning loops and fewer dead-end builds, as ideas are tested cheaply before full delivery.
- Better prioritization and resource allocation due to visual comparison and pruning of branches.
- Stronger alignment across product, design, engineering, sales, and leadership around outcome-focused discovery.
- More customer-centric solutions, since opportunities come from observed pains and jobs, not internal brainstorming alone.
Need Help?
If you are looking for more help on doing this for your organization, connect with Optiblack over a 15 mins call from here
-3.png)
-4.png)
-4.png)