
.png)
There are about 9M+ software apps and 27M+ eCom Websites in the world.
The real challenge for the company leaders is to get product adoption and monetisation.
Optiblack started as a product growth firm in Jan 2022
When working with CXOs, we soon found out that companies do not have a measurement framework in place to know whether whatever tech development they are doing is leading to an impact or moving the business metrics and CXOs used to feel if they are moving the firm in the right direction
This is the problem that Revenue Accelerator Solves
We work with CXOs to scale companies in the right direction using data to drive impact and revenue. Worked with 70+ firms and drove $300M+ in impact
In the next step, we will show the overall framework and steps we follow to achieve this.
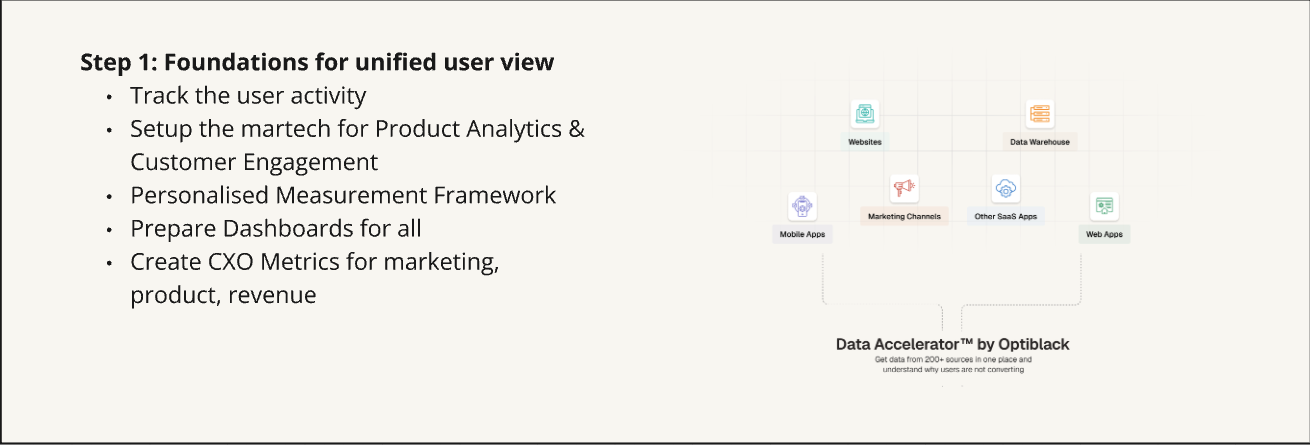
4 Step Data2Dollar Framework
Track ➝ Analyse ➝ Implement ➝ Impact
Steps in Detail
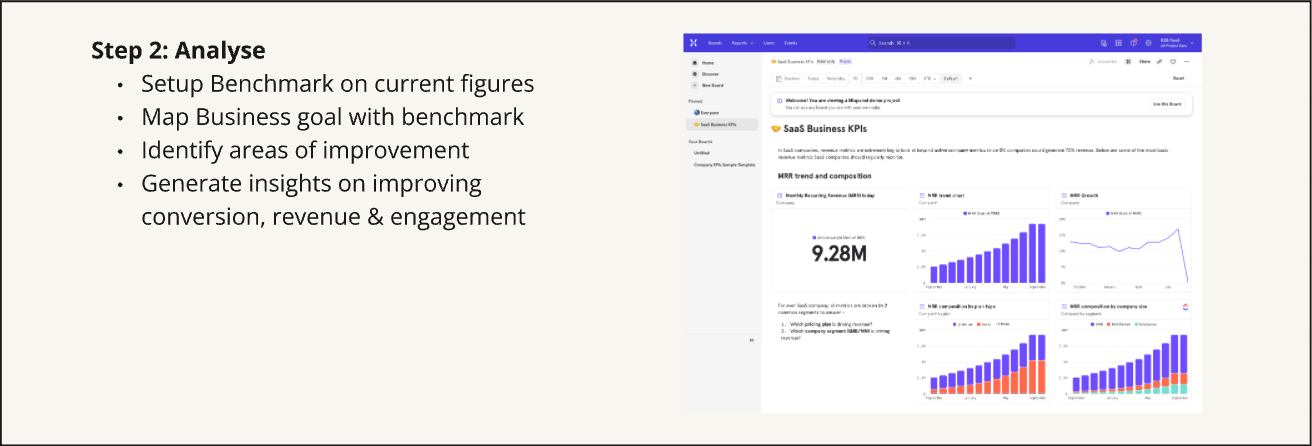
Many times companies want to understand how data impacts revenue.
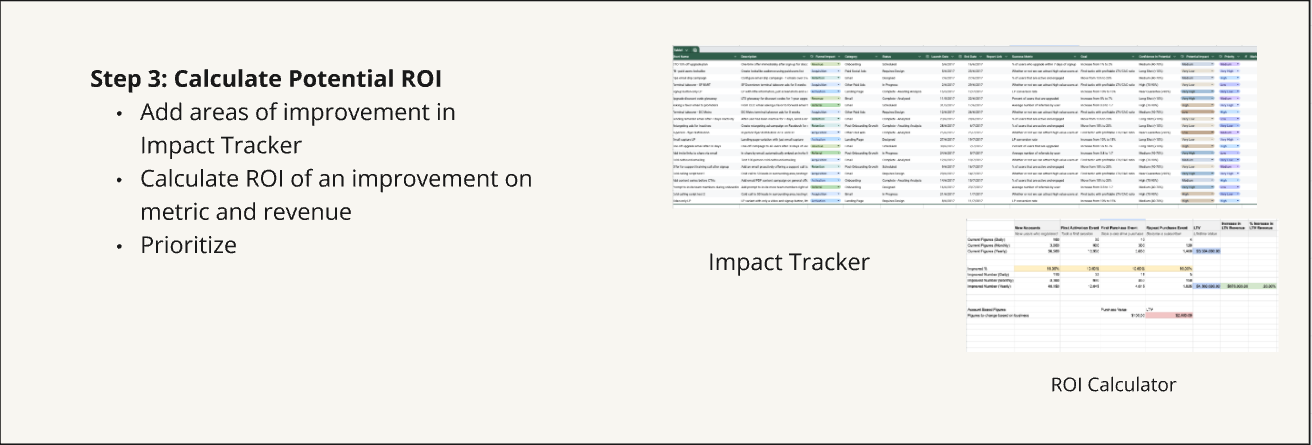
Here is the framework we use to make a business case and we call this as ROI Calculator
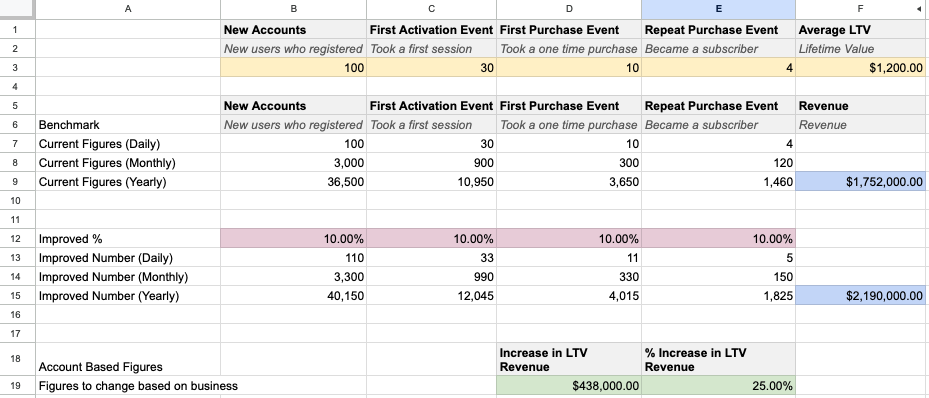
This gives the comparison of current figures and how the revenue will change based on improvements done
How to set this up
- Input the values in Yellow cells based on the figures as per the current benchmark
- Assuming 10% improvement
- Look at possible an increase in revenue due to the impact
A small change in this funnel leads to higher LTV and repeat rate leading to higher revenue with the same marketing input.
Optiblack’s focus is on measuring this and working as an extension of your team to improve these daily numbers leading to an increase in revenue
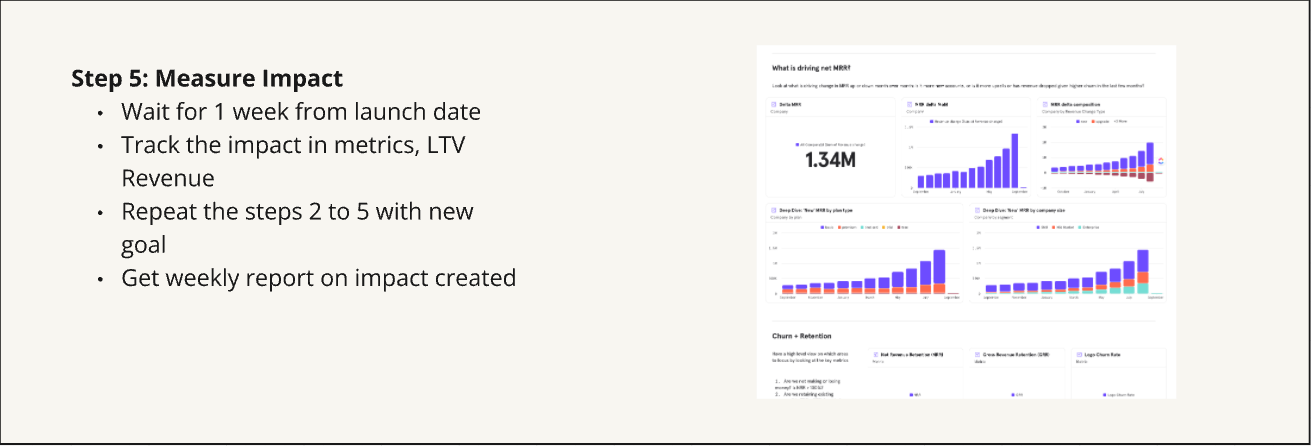
The way we do this is through Impact Tracker
Steps for Impact Tracker
- Set the foundation measurement
- Set the current benchmarks,
- Identify areas of opportunity in conversion from new account registrations, activation numbers, first-time purchases and repeat purchases.
- Prioritise based on potential ROI from the ROI Calculator Sheet
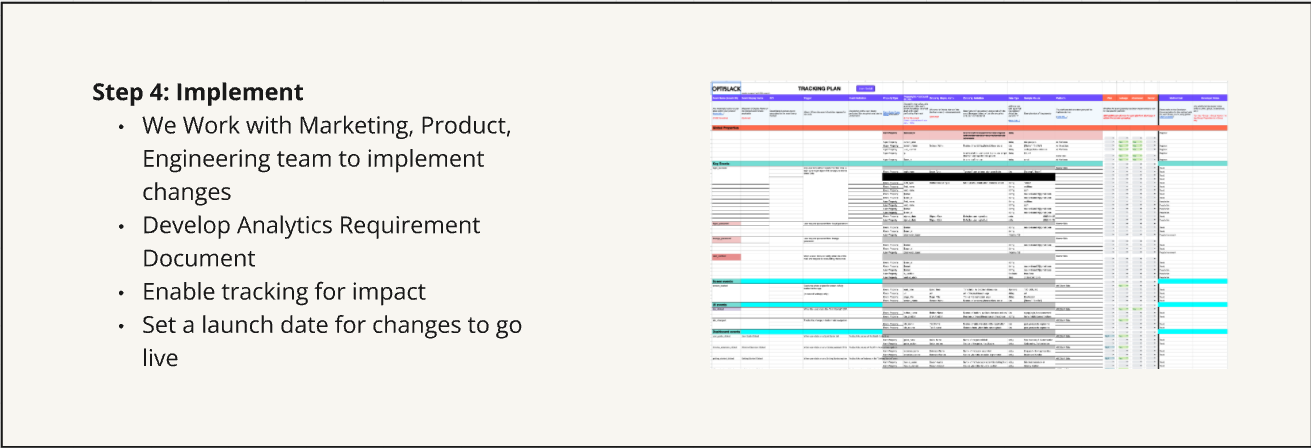
- Get the changes implemented
- Measure the improvement 2 weeks after the changes.
This is how we work with companies to drive revenue from data. If you would like to talk further, find 15 mins from here and we will make a business case for you on the call
-3.png)
-4.png)
-4.png)