Background
The AgriTech company aims to target its top two priorities of understanding customers and improving agent productivity by consolidating data from multiple systems. Currently, the organization relies on several disparate platforms to manage marketing, customer engagement, transactions, and agent-customer interactions. These fragmented datasets make it difficult to derive unified insights into customer behavior, campaign effectiveness, and agent performance.
The goal of this initiative is to design and implement a centralized data architecture that integrates these diverse sources into a unified analytical model. This will enable the creation of a single view of the customer (Customer 360) and a comprehensive agent performance tracking system.
Business Objectives
- Customer 360° View:
Build a unified customer profile integrating data from marketing campaigns, app interactions, calls, and transactions. - Agent Performance Analytics:
Track agent effectiveness across different call and conversion metrics. - Marketing ROI Measurement:
Calculate customer acquisition cost (CAC), campaign conversion rates, and channel efficiency. - Operational Efficiency:
Enable data-driven decision-making through automated ETL pipelines and unified reporting dashboards.
Data Sources and Integration
A modern customer-focused retail eCommerce organization typically relies on a diverse ecosystem of platforms, each serving a different purpose across the customer lifecycle. A CRM system manages transactions and lifecycle data, while call-tracking solutions capture agent–customer interactions in detail. Marketing platforms drive acquisition campaigns and generate lead intelligence, and customer engagement systems monitor app activity, user behavior, and communication responses. Although each system plays a critical role, they operate in silos—making unified insights essential for understanding customers end-to-end and optimizing operational performance.
Given below was the tech stack at the AgriTech Company where the solution was delivered
|
Source |
Description |
Key Data Points |
|
Callyzer & Knowlarity |
Agent call data platforms |
Call duration, call start/end time, agent ID, customer ID, call type (inbound/outbound), call recording URL |
|
Google Ads & Meta Ads |
Digital campaign data |
Campaign ID, Ad group, Clicks, Impressions, CTR, Conversions, Spend, Customer leads |
|
WebEngage |
Customer engagement and app behavior |
Customer app activity, session details, push notification engagement, funnel events |
|
Zoho CRM |
Customer transactions and lifecycle data |
Transaction ID, Product type, Revenue, Date, Customer ID, Payment details |
|
Offline Customer Master |
Agent calling base |
Customer name, contact details (Phone, Email Address) |
|
Trackier |
Affiliate and campaign performance tracking |
Source, medium, campaign cost, attributed conversions, ROI metrics |
Proposed Data Architecture
-
Medallion Architecture
The solution will adopt a multi-layered Medallion Architecture approach, structured into three progressive tiers — Bronze (Raw Data Layer), Silver (Cleansed & Enriched Layer), and Gold (Curated Business Layer) — to ensure data quality, consistency, and optimized analytics delivery.
-
Layer Definitions
- Bronze Layer (Raw Ingestion Layer)
- Stores raw data ingested from all sources in its native format.
- Data is ingested via APIs, S3 dumps, and connector-based
- Silver Layer (Cleansed & Conformed Layer)
-
- Performs cleaning, standardization, and joins to prepare analytical datasets.
- Gold Layer (Curated Business Layer)
-
- Hosts curated unified views and KPI-ready data marts.
- Two key subject areas:
- Customer 360 Unified View
- Agent Performance & Efficiency View
-
Architecture
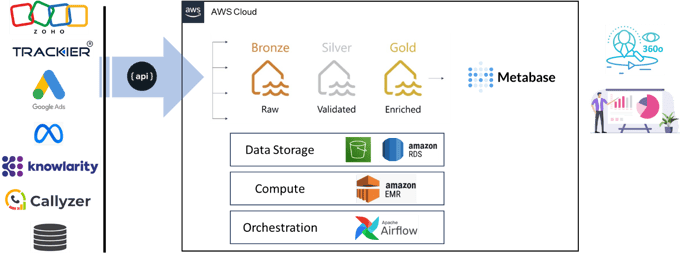
The architecture illustrates how data from multiple business systems—such as marketing platforms, call-tracking solutions, CRM systems, affiliate channels, and offline records—is ingested and unified through a modern cloud-based data pipeline. All source data is pulled via APIs and funneled into the Medallion Architecture, which organizes processing into three layers: Bronze (raw ingestion), Silver (validated and standardized data), and Gold (fully enriched, analytics-ready datasets).
These curated datasets are stored in cloud storage - AWS S3 and processed using scalable compute services - AWS EMR. The transformation workflows are orchestrated through a scheduler - (Open Source) Airflow that ensures reliable, automated end-to-end data movement. Once the data reaches the Gold layer, it is loaded into a relational analytics database - AWS RDS for consumption through (Open Source) Metabase across dashboards, reports, and advanced analytics use cases.
By centralizing data from previously fragmented systems and applying structured refinement through the Medallion approach, the organization achieves a scalable, high-quality foundation for analytics and decision-making.
Note: This architecture is cloud-agnostic and can be implemented using equivalent services across any cloud provider or technology stack, depending on the organization’s scale, preferences, and tooling ecosystem.
Unified Data Models (Gold Layer)
1. Customer Cross Reference / X-Ref a.k.a Customer Master
Achieving a unified Customer 360 requires consolidating customer identifiers that originate from multiple systems—each using its own format, unique keys, and sometimes inconsistent or duplicate attributes.
The Customer XRef is built using a combination of deterministic and probabilistic identity resolution techniques. Deterministic matching relies on strong identifiers such as phone number, email address, CRM Customer ID, or device ID (from WebEngage). Probabilistic matching comes into play when identifiers differ across systems or contain errors (e.g., variations in customer name, outdated phone numbers, multiple leads for the same person).’
Considering probabilistic identity resolution can become complex in no time, deterministic resolutions provide the required actionable insights for most companies until they reach a point to invest in an advanced implementation of Customer Master.
|
Column Name |
Description |
|
Customer ID |
Global Customer ID (primary key across all systems) |
|
Phone Number |
Standardized mobile number (primary deterministic match key) |
|
Email Address |
Email identifier for campaigns & CRM |
|
Zoho Customer Id |
Customer ID from Zoho CRM |
|
Webengage User Id |
Anonymous or logged-in user ID from WebEngage |
|
Google Lead Id |
Lead ID from Google Ads |
|
Meta Lead Id |
Lead/ad form ID from Meta |
|
Affiliate Lead Id |
Lead ID from Trackier |
|
Call Platform Customer Id |
ID used by Callyzer / Knowlarity |
|
Offline Customer Id |
ID from the offline calling master |
|
Customer Name |
Cleaned, standardized customer name |
|
Match Confidence Score |
Confidence score for probabilistic matching (0–1 range) |
|
Match Method |
e.g., ‘phone_exact’, ‘email_exact’, etc. |
This structure ensures consistency in customer analytics, reduces duplication, improves CAC and ROI attribution accuracy, and establishes the foundation for personalized omnichannel marketing and agent productivity insights.
2. Customer 360 Unified View
The Customer 360 Unified View brings together every interaction, attribute, and touchpoint related to a customer into a single, consolidated profile. By integrating identifiers across marketing platforms, CRM systems, call systems, app engagement tools, and offline sources, each customer is assigned a unique master ID that serves as the anchor for all analytics. This unified profile captures demographic details, acquisition channels, app behavior patterns, call history, transaction insights, campaign interactions, and even agent assignments. With this holistic view, business teams can understand the complete customer journey end-to-end, personalize engagement, measure true ROI, and make data-driven decisions that improve both customer experience and operational efficiency.
|
Dimension / Metric |
Description |
|
Customer ID |
Unique master ID mapped across all systems |
|
Demographics |
Name, contact, location, segment, acquisition source |
|
Acquisition Channel |
Google, Meta, Offline etc. |
|
App Behavior |
WebEngage engagement score, active sessions, notification engagement |
|
Call History |
Number of calls, average call duration, call response rate |
|
Transactions |
Total spend, frequency, last transaction date |
|
Campaign Interaction |
CTR, clicks, impressions, campaign cost |
|
Agent Mapping |
Assigned agent(s) with engagement status |
KPIs:
- Active customers (weekly/monthly)
- Conversion rate (leads → paying customers)
- Customer retention rate
- Average revenue per customer (ARPU)
- CAC (Customer Acquisition Cost)
3. Agent Performance View
The Agent Performance View provides a comprehensive lens into how effectively each agent engages with customers across all connected systems. By unifying agent identifiers and consolidating metrics such as total calls, average call duration, active calling hours, and customer coverage percentage, the organization gains a clear understanding of both activity levels and outcome-driven performance.
This unified view ultimately ensures that agent performance is measured fairly, accurately, and strategically.
|
Dimension / Metric |
Definition |
|
Agent ID |
Identifier of the Agent mapped across all the systems |
|
Total Calls |
Total number of calls made by the agent |
|
Avg. Call Duration |
Average time per customer call |
|
Call-to-Conversion Rate |
% of calls leading to app registration or transaction |
|
Active Calling Hours |
Hours actively spent on customer calls |
|
Customer Coverage % |
% of assigned customers contacted |
|
Conversion per Agent |
Number of successful conversions |
Derived KPIs:
- Agent Efficiency Index = (Conversions ÷ Total Calls) × 100
- Top Performing Agents = Agents with the highest conversions and lowest idle time
Outcomes and Benefits
- Unified Customer Insight – A single, reliable view of each customer improves targeting, personalization, and lifecycle understanding.
- Accurate Attribution & ROI Measurement – Clear mapping of leads to campaigns, calls, and transactions enhances CAC accuracy and marketing efficiency.
- Improved Agent Productivity – Transparent KPIs and performance dashboards enable better coaching, resource planning, and higher conversion rates.
- Stronger Decision-Making – Leadership gains timely, trustworthy insights to optimize campaigns, customer engagement, and sales strategies.
- Operational Efficiency – Automated pipelines reduce manual effort, ensure consistent data quality, and accelerate reporting.
- Scalable Analytics Foundation – The architecture supports advanced models like churn prediction, lead scoring, and next-best-action recommendations.
Infra Structure Costs
Below is a quick summary of Infra-Structure cost required for this set-up on AWS using the native services in relation to the data volume –
AWS Services Involved:
- S3 for Raw data ingestion & Storage
- EMR for Big Data Processing
- EC2 instance for hosting Airflow Scheduler
- RDS instance for data serving layer
- EC2 instance for hosting Metabase
|
Events (per day) |
Incremental Data Size (Per Month) |
Monthly Infra Cost ($) |
|
20k – 100k |
20GB – 50GB |
$ 2500 - $3200 |
|
100k – 1mn |
50GB – 500GB |
$3200 - $6000 |
|
1mn – 10mn |
500GB – 2TB |
$6000 - $10,000 |
Note that these costs are for reference purposes only and are put together assuming primary data security principles and inherent DR capabilities. It is derived basis on-demand pricing in the ap-south-1 (Mumbai) region. With increased data volume, we recommend using a more scalable solution using Databricks or Snowflake.
Conclusion
This AgriTech data platform unifies all customer and agent data streams into a single governed ecosystem. The design supports continuous scaling, accurate marketing attribution, and deep operational insights — enabling the company to optimize customer acquisition, improve agent efficiency, and ultimately accelerate rural digitization and growth.