Cloud Cost Benchmarking for SaaS Firms
Learn how SaaS companies can effectively manage cloud costs, optimize spending, and implement best practices for sustainable growth.
Explore the top tools for tracking PaaS costs in 2025, featuring real-time analytics, detailed reporting, and multi-cloud support.
Managing PaaS costs is challenging due to consumption-based pricing and multiple service providers. To simplify this, specialized tools offer features like real-time monitoring, detailed reporting, and budget alerts. Here are the top 7 tools for tracking PaaS expenses in 2025:
| Tool Name | Cloud Platforms | Real-Time Analytics | Reporting Granularity | Alerts | Integration Options |
|---|---|---|---|---|---|
| AWS Elastic Beanstalk | AWS | Yes | Application-level | Yes | ERP, Billing APIs |
| Microsoft Azure App Service | Azure | Yes | Subscription, Resource Group | Yes | Power BI, Excel |
| Google App Engine | Google Cloud | Yes | Project, Service | Yes | BigQuery, Sheets |
| CloudZero | Multi-cloud | Yes | Business-driven | Yes | BI Tools, APIs |
| Northflank | Multi-cloud | Yes | Application-level | Yes | ERP, Webhooks |
| IBM Cloud Foundry | IBM Cloud | Yes | Organization, Space | Yes | REST APIs, ERP |
| Oracle Cloud Platform | Oracle Cloud | Yes | Multi-cloud | Yes | Open APIs, ERP |
These tools simplify PaaS cost tracking, helping businesses allocate resources effectively and control budgets.
Keeping an eye on the right metrics is crucial to managing PaaS spending effectively and finding ways to cut unnecessary costs.
One of the most important metrics is cost per application. By breaking down expenses for each application, you can pinpoint which ones consume the most resources and look for ways to optimize their usage.
Another key indicator is resource utilization rates, which show how efficiently resources like CPU, memory, storage, and bandwidth are being used. If utilization is too low, it could mean you're over-provisioning resources. On the other hand, high utilization might signal a need to scale up. Using tracking tools helps strike the right balance between performance and cost.
Cost variance analysis compares your actual spending to your budgeted amounts. Identifying and monitoring significant differences early on allows finance teams to adjust forecasts or budgets to stay on track.
Forecast accuracy is another critical metric, measuring how closely your cost predictions align with actual spending over time. This is particularly useful for annual budgeting, as it ensures your planning process is reliable.
Beyond tracking metrics, PaaS cost management tools come loaded with features designed to improve how you manage expenses:
These metrics and features form the backbone of effective PaaS cost management and set the stage for the tools discussed in the next section.
AWS Elastic Beanstalk comes with a range of tools designed to help you track and manage your platform-as-a-service (PaaS) expenses. These tools integrate seamlessly with other AWS services, making it easier to monitor costs across your entire cloud setup.
At the core of Elastic Beanstalk's cost management are AWS Cost Explorer and AWS Budgets. Cost Explorer breaks down your spending by service, region, and time period, giving you a clear picture of where your money is going. Meanwhile, AWS Budgets lets you set spending limits and sends alerts when you’re nearing those thresholds. Together, these tools provide insights and help you avoid unexpected cost spikes.
Elastic Beanstalk supports near real-time cost tracking through its integration with CloudWatch, which updates spending data every few hours. The analytics dashboard shows how resources like CPU usage, network traffic, and storage consumption affect your costs. By correlating resource usage with spending, you can quickly spot and address cost increases.
For even more precision, AWS Cost Anomaly Detection uses machine learning to flag unusual spending patterns. If something deviates significantly from your typical usage, the system sends alerts to your team. This is particularly useful for catching misconfigured auto-scaling policies or other unexpected changes that could drive up costs.
Elastic Beanstalk also offers detailed reporting options, allowing you to break down costs by application, environment, or specific AWS resources. The AWS Cost and Usage Report provides hourly usage data, complete with resource tags, so you can allocate costs to departments, projects, or clients with precision. These reports can be exported in CSV format for deeper analysis in tools like spreadsheets or business intelligence platforms.
Resource tagging is another key feature, letting you categorize costs by up to 50 tags per resource. This gives you the flexibility to organize expenses in a way that aligns with your internal workflows.
AWS makes it easy to integrate Elastic Beanstalk cost data with your existing billing and financial systems. The AWS Billing and Cost Management API allows you to pull cost data programmatically and connect it to ERP systems, accounting software, or custom dashboards.
Many businesses use AWS Cost and Usage Reports to automatically feed cost data into their financial systems. These reports can be delivered to Amazon S3, where ETL tools can process them to match your company’s accounting structure. This automation reduces manual work and ensures accurate cost reporting.
For organizations managing multiple AWS accounts, consolidated billing and AWS Organizations simplify centralized cost management. These features provide a unified view of spending while still tracking costs by individual business units. They also apply volume discounts to consolidated usage and allow you to enforce spending controls through service policies.
Microsoft Azure App Service offers powerful tools to help you understand and manage your PaaS spending. At the heart of these tools is Azure Cost Management + Billing, which provides detailed insights into how your App Service resources are being used and what they cost. With this foundation, you can dive into real-time analytics, generate detailed reports, and seamlessly integrate billing data into your financial systems.
One of Azure's strengths lies in its integration within the larger Microsoft ecosystem. The Azure Cost Management dashboard brings together all your Azure expenses, including App Service costs, into a single view. This unified perspective makes it easier to see how your App Service spending fits into your overall cloud budget. You can even look back at historical spending data for up to 13 months, which is incredibly helpful for planning and forecasting.
Azure App Service makes it easier to stay on top of costs with near real-time tracking. Through its integration with Azure Monitor and Application Insights, cost data is refreshed every 8–24 hours. This frequent updating helps you quickly detect unusual spending patterns and address them before they become a bigger issue.
The Cost Analysis tool provides interactive charts that link resource usage to spending, helping you identify underutilized or oversized instances. You can dig into specific metrics like compute hours, storage usage, and data transfer costs to get a clearer picture of where your money is going.
To further assist, Azure's Advisor service offers actionable recommendations for optimizing costs. Based on your App Service usage patterns, it might suggest resizing instances, enabling auto-scaling, or using reserved capacity pricing for workloads that are more predictable.
Azure provides detailed cost breakdowns through its Cost Management portal, giving you the ability to analyze spending with precision. Costs can be segmented by subscription, resource group, or custom tags, and you can apply up to 15 filters simultaneously for a highly tailored view of your data.
These custom tags are automatically included in your cost reports, which simplifies expense allocation for chargeback or showback purposes. Reports can be scheduled and exported in CSV format, making it easy to analyze the data further using tools like Excel or Power BI. For those needing detailed insights, hourly granularity is available for the most recent billing period.
Azure App Service also simplifies financial management by integrating billing data with your existing systems. Through APIs and export options, you can connect Azure costs directly to your ERP, accounting software, or custom dashboards. The Azure Consumption API provides programmatic access to usage and billing data, streamlining how you pull in cost information.
Azure cost data works seamlessly with Power BI and Excel, using pre-built templates and connectors. The Azure Cost Management Power BI App offers ready-made visualizations that you can customize to fit your specific reporting needs.
For Enterprise Agreement customers, Azure provides even more advanced billing features. These include cost allocation across departments or business units, support for complex billing hierarchies, and automatic application of negotiated discounts and credits. In multi-tenant setups, the Customer Usage Attribution feature allows you to track costs for specific customers or projects, which is especially useful for managed service providers and software vendors.
Google App Engine offers robust tools for tracking and managing your spending through Google Cloud Billing and the Cloud Console. These tools provide a clear view of where your platform-as-a-service (PaaS) budget is being allocated. You can monitor costs across various services and versions within your applications, ensuring you stay informed about your expenses.
The Cloud Billing Reports feature is your go-to dashboard for analyzing App Engine costs. It breaks down expenses by categories such as compute instances, storage, network egress, and API calls. You can further filter these costs by specific App Engine services or versions, giving you a detailed understanding of your spending patterns. This level of detail sets the foundation for real-time cost management and analysis.
Google App Engine updates cost data within 24 hours, making it possible to monitor spending almost in real time. By integrating with Cloud Monitoring, you can link resource usage metrics - like instance hours, request volume, or data transfer - with billing data to pinpoint what’s driving your costs.
The Cloud Console enhances this experience with interactive charts that let you dive into specific timeframes and services. You can review costs by day, week, or month, and the system flags unusual spending spikes, which could signal configuration problems or unexpected surges in traffic. Additionally, Google's Operations Suite (formerly Stackdriver) ties performance metrics directly to cost data, helping you balance application performance with cost efficiency.
App Engine’s billing system provides detailed cost breakdowns, allowing you to segment expenses by project, service, location, or custom labels. You can use up to 64 labels per resource, making it easier to organize and track costs across teams, environments, or clients.
Reports are highly customizable, offering grouping options and time ranges that go back as far as 12 months. You can export billing data in CSV format or connect it to BigQuery for advanced analysis using SQL queries. The Cloud Billing API also enables programmatic access to cost data, making it simple to automate reporting or integrate with custom dashboards.
To streamline cost attribution, App Engine links every resource to its associated service-level information. Custom labels can be added during deployment to track costs by team, project phase, or client, simplifying chargeback and showback processes. These tools give you greater financial control, making it easier to manage your PaaS expenditures effectively.
Google App Engine makes financial management easier with strong API integrations and export options. The Cloud Billing API lets you pull cost data directly into ERP systems, accounting software, or custom dashboards. You can also connect billing data to Google Sheets using data connectors, enabling the creation of tailored financial reports that can be shared across your organization.
For enterprise users, the platform supports complex organizational structures and applies committed and sustained use discounts to help reduce costs. Budget alerts can be set up to notify stakeholders when spending approaches predefined limits. These alerts integrate with Cloud Pub/Sub and Cloud Functions, enabling automated actions like scaling down non-essential services or sending timely notifications to prevent overspending.
CloudZero provides a clear view of multi-cloud PaaS costs by linking expenses to business outcomes. This is achieved through mapping costs to specific features, teams, or customers. Unlike tools that focus on just one cloud platform, CloudZero aggregates data from multiple providers. With this unified approach, it enables businesses to manage their multi-cloud finances more effectively.
CloudZero streamlines cost data from various cloud providers into a consistent format, making it easier to compare spending across PaaS platforms. By converting different billing models into a unified cost structure, it gives you clarity on the financial impact of running similar applications across different clouds. Whether you're using multi-cloud or hybrid setups, CloudZero offers a complete view of your PaaS investments, factoring in elements like data transfer costs.
The platform processes cost data almost instantly, using anomaly detection to differentiate between growth-related trends and unexpected spikes caused by configuration issues. Alerts are sent through various channels, allowing for quick responses. Its ability to normalize costs across multiple cloud providers ensures consistent and actionable insights, no matter your cloud mix.
CloudZero goes beyond basic insights with detailed reporting that breaks down costs by key business areas, such as customers, features, teams, or environments. Customizable reports and historical trend analysis allow you to pinpoint cost spikes, calculate metrics like cost per customer or transaction, and identify areas for cost efficiency.
CloudZero integrates seamlessly with popular business intelligence tools and provides API access, making it easy to incorporate PaaS cost data into your existing financial workflows. It supports internal cost allocation methods like chargebacks and showbacks and works with budgeting tools to help monitor spending and predict future costs based on current trends.
For businesses relying on data-driven strategies, CloudZero complements digital product analytics by offering detailed visibility into the operational costs of digital products. This transparency enables smarter decisions around resource allocation and platform optimization.
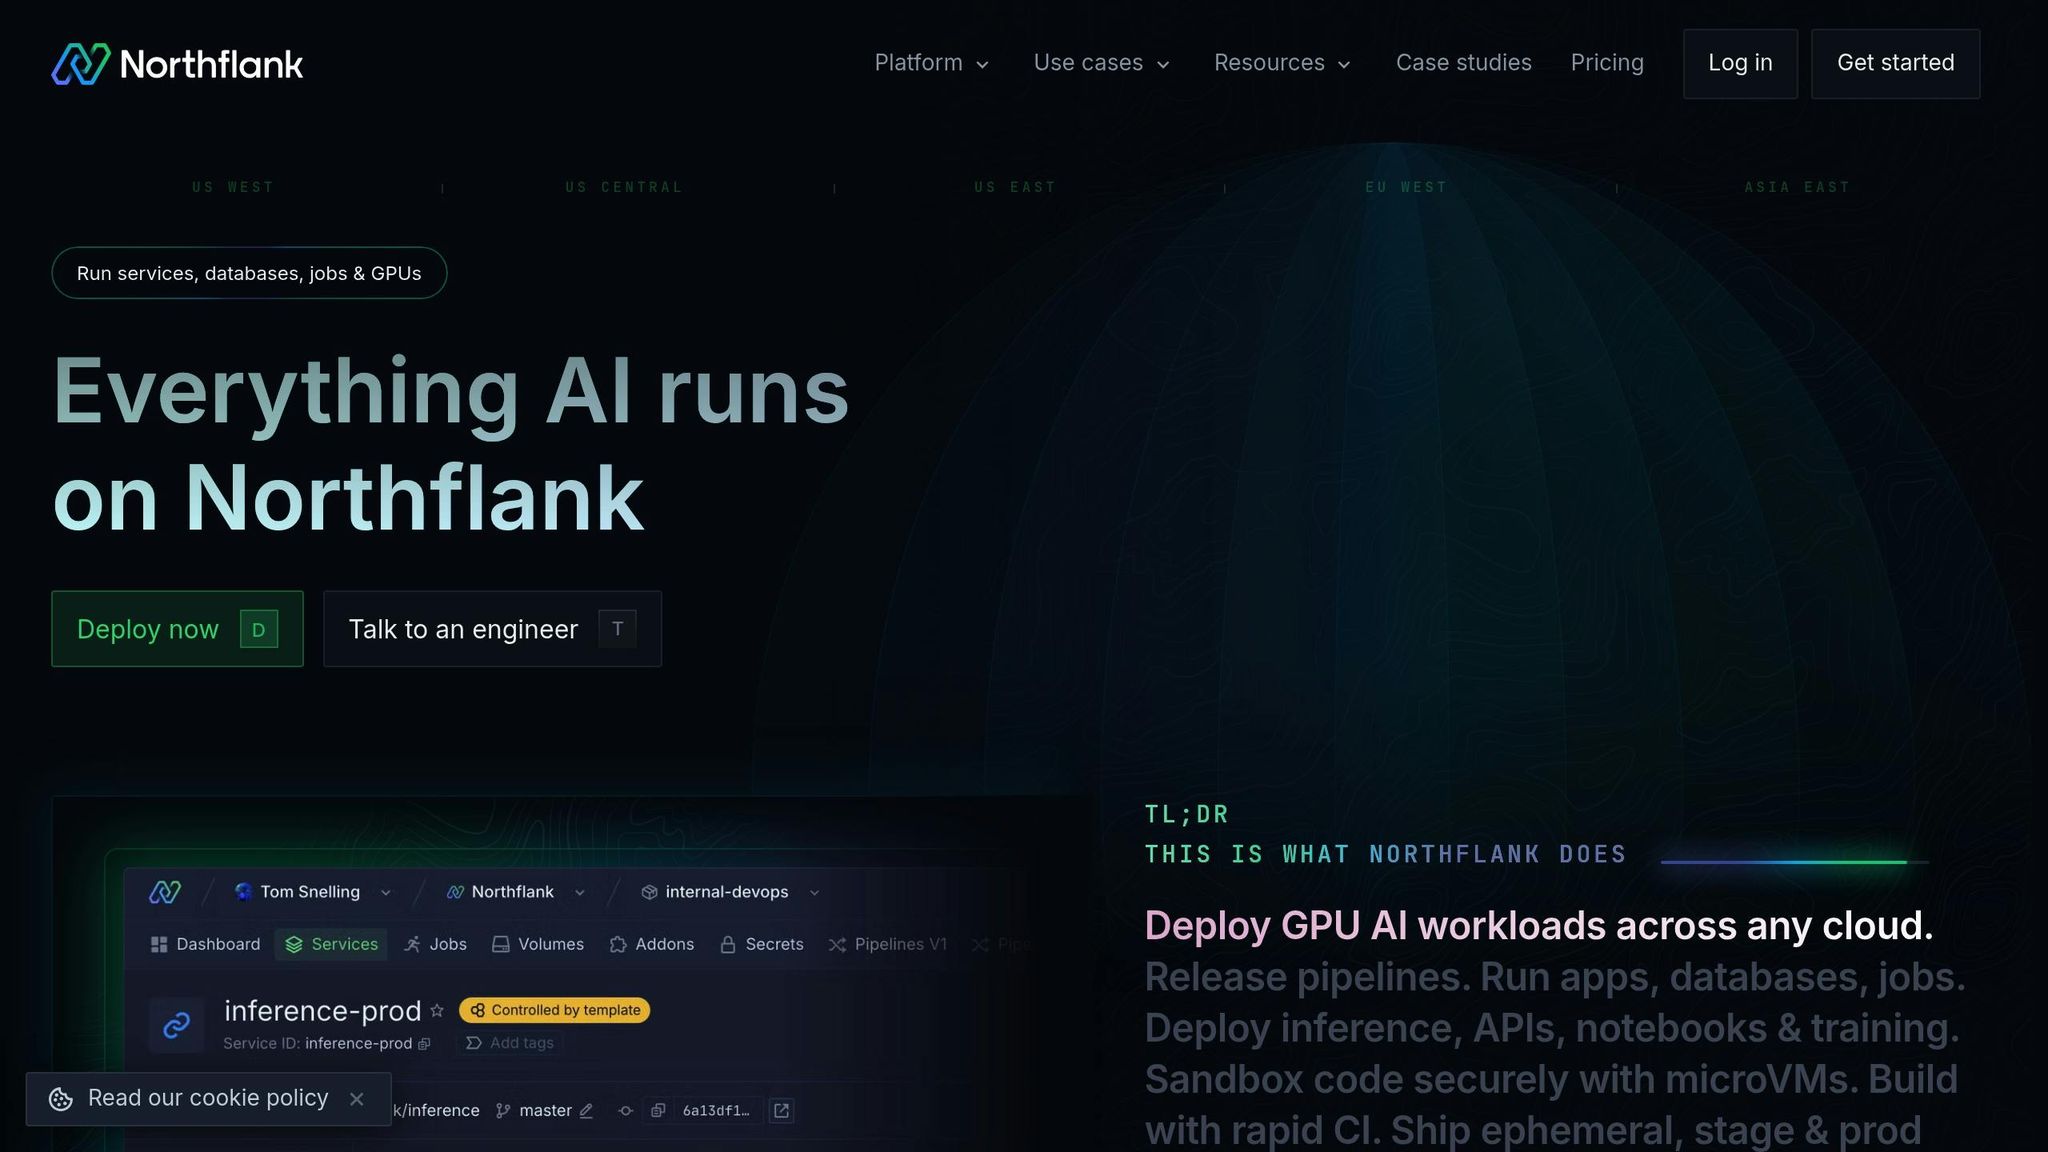
Northflank offers tools that make it easier for developers and finance teams to keep track of platform expenses. By focusing on key PaaS metrics like cost per application and resource usage, it provides a clear picture of spending. The platform is designed for containerized application deployments and offers detailed cost tracking across various cloud environments.
Northflank updates cost data within hours, directly tying spending information to deployment metrics and application performance. Its dashboard shows how resources like CPU, memory, and storage are being used and connects these details to actual costs. This makes it simple to spot costly applications or inefficient resource usage. The platform also uses automated anomaly detection to flag unusual spending, such as unexpected scaling or resource leaks, and sends alerts via Slack, email, or webhooks.
The platform provides detailed cost breakdowns by project, environment, service, and even custom tags. You can filter reports by timeframes ranging from a few hours to several months, and export the data as CSV files for deeper analysis. Using its tagging system, teams can allocate costs more precisely - whether by team, client, or development stage - making chargebacks and budgeting much easier.
What sets Northflank apart is its focus on developer-centric cost metrics. Instead of just tracking infrastructure expenses, it zooms in on costs at the application and microservice levels. This includes insights like cost-per-deployment and the financial impact of code releases. Such detailed tracking helps teams predict expenses more accurately based on development cycles and scaling needs.
Northflank's API allows for easy integration with financial tools like ERP platforms and accounting software. It supports webhook-based notifications for spending updates and offers programmatic access to historical cost data. Teams can also set budget controls to automatically scale down non-production environments when spending hits a certain limit, helping to avoid unnecessary costs.
These features provide a solid foundation for comparing Northflank’s cost tracking capabilities with other platforms in the next section.
IBM Cloud Foundry offers tools to keep track of PaaS costs with detailed insights into application-level usage. It integrates seamlessly with IBM's cloud ecosystem and supports a range of deployment models, making cost management more efficient.
With IBM Cloud Foundry, you get real-time analytics to monitor your spending. The platform tracks resource usage at the application instance level, covering CPU, memory, and network bandwidth. It also provides live dashboards to project monthly expenses. If there are cost spikes or unusual patterns, the analytics engine sends alerts via email, SMS, or enterprise notifications. These early warnings help teams address issues quickly and avoid unexpected budget overruns.
The reporting tools allow you to break down costs by organization, space, application, or service binding for a more precise understanding. With historical data retention, you can analyze trends and make accurate cost comparisons. Cost allocation is simplified through tagging and labeling, enabling finance teams to assign expenses to specific business units, projects, or clients. Reports can be scheduled regularly and exported in various formats for deeper financial analysis.
While IBM Cloud Foundry is primarily designed for IBM Cloud infrastructure, it also supports hybrid environments. Using hybrid cloud connectors, it aggregates cost data from on-premises deployments, providing a unified view of expenses across different environments. This consolidated view helps teams compare spending across deployment targets and make decisions based on actual usage.
IBM Cloud Foundry connects with enterprise financial systems through its REST API and pre-built connectors for popular ERP platforms. This integration automates cost center allocation and supports internal chargeback processes. Administrators can also set budget controls and spending limits at different organizational levels. These features help prevent budget overruns while ensuring critical services remain operational.
Next, we’ll explore Oracle Cloud Platform's billing and cost management features.
The Oracle Cloud Platform's Billing and Revenue Management (BRM) system brings together payments, invoicing, collections, taxation, and ledger integration into one cohesive solution.
With Oracle, you can export detailed usage reports in CSV format, making it easier to reconcile invoices and dive deep into usage analysis.
Oracle Cloud Cost Management enhances its reporting capabilities by integrating seamlessly with existing cloud management tools, offering flexibility across multi-cloud setups.
Oracle's Cloud Scale Billing leverages an Open API, enabling smooth integration with modern digital ecosystems and intricate value chains. Its flexible billing models - like subscription plans and partner settlements for B2B2X - offer adaptability for various business needs. Additionally, the API-powered SaaS revenue management solutions allow quick and efficient integration with other applications in the ecosystem.
"A big benefit in consolidating down to one single billing system was the ability to track delinquency, unbilled and all other types of metrics." - Rick Misch, Vice President of Commercial Billing and Collection Services, Anthem
Below is a streamlined comparison of key features across various PaaS cost tracking tools. Use this table to identify the platform that aligns best with your cloud environment, budget, and operational needs.
| Tool Name | Cloud Platforms | Real-Time Analytics | Detailed Reporting | Alerting | Pricing Model |
|---|---|---|---|---|---|
| AWS Elastic Beanstalk Cost Management | AWS | Yes | Yes | Yes | Usage-based |
| Microsoft Azure App Service Cost Analytics | Azure | Yes | Yes | Yes | Consumption-based |
| Google App Engine Billing Insights | Google Cloud | Yes | Yes | Yes | Usage-based |
| CloudZero Multi-Cloud Cost Intelligence | AWS, Azure, GCP | Yes | Yes | Yes | Custom pricing |
| Northflank Platform Cost Monitoring | Multi-cloud | Yes | Yes | Yes | Subscription-based |
| IBM Cloud Foundry Cost Tracking Tools | IBM Cloud | Yes | Yes | Yes | Subscription-based |
| Oracle Cloud Platform Billing Management | Oracle Cloud | Yes | Yes | Yes | Enterprise pricing |
Each tool in the table offers real-time analytics, detailed reporting, and alerting capabilities, ensuring comprehensive cost management. Pricing models range from usage-based and subscription plans to custom enterprise options, allowing flexibility based on your organization's billing preferences.
For businesses operating in the U.S., compliance support and reliable local assistance add extra value. Additionally, alerting features vary, from basic notifications to advanced anomaly detection, providing proactive solutions to control costs effectively.
This table serves as a quick reference to help you choose the most suitable tool for managing your PaaS costs efficiently.
Choosing the right PaaS cost tracking tool is essential for managing resources efficiently and reducing IT expenses. The tools discussed here highlight how strategic cost management can make a significant difference.
We explored seven solutions that offer real-time analytics, detailed reporting, and proactive alerts to help businesses stay on top of their cloud spending. By using these tools, companies can move from simply reacting to financial surprises to planning ahead with confidence. Consider working with technology partners like Optiblack to benefit from advanced analytics and a strong data infrastructure.
The right cost tracking tool can transform your cloud operations into a streamlined and budget-friendly process.
PaaS cost tracking tools play a crucial role in helping businesses keep their cloud expenses under control. They provide real-time insights into spending, making it easier to spot inefficiencies, monitor resource usage, and catch potential budget overruns before they become a problem. This allows businesses to make smarter decisions and cut down on unnecessary costs.
These tools also simplify tasks like automated expense reporting and budget tracking, ensuring financial limits are easier to manage. By aligning cloud spending with business goals, they help companies allocate resources effectively and get the most value out of their investments while improving overall operational efficiency.
AWS Elastic Beanstalk and Microsoft Azure App Service both provide solid options for keeping tabs on costs, but they take slightly different routes to get there. AWS Elastic Beanstalk comes with a comprehensive Billing and Cost Management dashboard. This tool gives users a straightforward view of their spending, including detailed summaries and month-to-date expense tracking. It’s a user-friendly way to stay on top of costs and usage.
In contrast, Microsoft Azure App Service connects seamlessly with Azure Cost Management. This integration offers advanced tools for setting budgets and performing detailed cost analysis, all tailored to fit Azure’s ecosystem.
The key difference lies in their focus: AWS leans into detailed billing insights, while Azure prioritizes cost management as part of its broader cloud framework.
Integrating PaaS cost tracking tools with financial systems makes managing budgets much smoother by providing up-to-the-minute insights into cloud spending. This allows businesses to predict expenses more precisely, spot unplanned costs, and adjust resource usage effectively.
Automation features in these tools take the hassle out of expense reconciliation and make it easier to catch unusual spending patterns early, minimizing the chances of overspending. By tying this integration into financial planning, companies can improve accountability and make more informed, data-backed decisions.
Learn how SaaS companies can effectively manage cloud costs, optimize spending, and implement best practices for sustainable growth.
Explore effective strategies for managing service discovery in multi-cloud environments, focusing on tools, security, latency optimization,...
Explore the trade-offs between SSL termination and end-to-end encryption for secure data transmission, focusing on performance, security, and...
Be the first to know about new B2B SaaS Marketing insights to build or refine your marketing function with the tools and knowledge of today’s industry.