Information
Deep Dive: Metric Trees
Discover how metric trees can enhance business performance by breaking down high-level goals into actionable sub-metrics for better decision-making...
Measure Kafka by customer-visible freshness, not broker metrics, to detect delays that break SaaS SLAs.
Kafka monitoring should answer one simple question first: are customers getting data on time? If you only watch broker health, you can miss the part that hurts your SaaS product most: slow billing, late alerts, stale analytics, and broken SLAs. One outage cited in the article led to $240,000 in SLA penalties in 62 minutes.
Here’s the short version of what I’d focus on:
I’d sum it up this way: good Kafka monitoring is less about watching every metric and more about seeing delay, failure, and blast radius early. That means starting with lag in time, checking the broker signals that point to hard failures, and adding end-to-end tracing so I can connect Kafka issues to customer impact fast.
Now that the difference between monitoring and observability is clear, it helps to zero in on the Kafka signals most tied to incidents.
A lot of SaaS teams try to watch everything at once. That usually backfires. You get flooded with alerts, and the stuff that matters gets buried. A better way is to focus on three areas that connect straight to cluster health, data flow, and customer impact.
Start with three metrics: UnderReplicatedPartitions (URP), OfflinePartitionsCount, and ActiveControllerCount.
OfflinePartitionsCount is simple: if it goes above 0, page immediately. That means data is unavailable for reads or writes.
ActiveControllerCount should always add up to exactly 1 across the cluster. If it drops to 0 or goes above 1, you're looking at a critical failure or a split-brain situation.
URP needs a bit more care. It can jump during rolling restarts, so paging on every short spike just creates noise. If URP stays above 0 for 5 minutes, page. It helps to think of URP less as an instant red siren and more as a metric that helps explain what went wrong.
Use the table below for operating thresholds.
| Metric | Healthy Range | Warning | Critical |
|---|---|---|---|
OfflinePartitionsCount |
0 | - | > 0 (immediate) |
ActiveControllerCount (cluster sum) |
1 | ≠ 1 for 5 min | ≠ 1 for 5 min |
UnderReplicatedPartitions |
0 | > 0 for 5 min | > 0 for 5 min |
| CPU Utilization | < 60% | > 60% (5-min avg) | > 80% |
| Disk Usage | < 70% | > 70% | > 85% |
| GC Pause Duration (P99) | < 200ms | > 200ms | > 500ms |
Once the brokers are steady, shift to data flow.
Track BytesInPerSec and MessagesInPerSec at both the broker and topic levels. If message volume drops all of a sudden, that's often a sign of producer failure. Sudden jumps in producer count or retries can point to client churn or retry storms.
Partition balance matters more than many teams expect, especially in shared SaaS setups. Watch LeaderCount and PartitionCount per broker. If one broker holds 60% of partition leaders, it ends up taking a much bigger share of CPU and I/O. That kind of skew gets noisy fast.
Lag across partitions is one of the easiest ways to spot this. If 9 partitions have zero lag but 1 has 100,000 messages backed up, the partition key distribution is uneven.
For storage, track both total log size and daily growth rate. That gives you time to see disk pressure coming before it turns into a critical alert.
When throughput changes, check lag next. That usually tells you whether the bottleneck sits with producers, brokers, or consumers.
Consumer lag is often the best proxy for downstream delay. But on its own, a raw lag number can send you in the wrong direction.
Trends matter more than totals. Trend-based alerting is usually more reliable than a fixed threshold. Instead of paging on one big number, alert when lag grows by more than 10,000 messages per minute over a sustained 10-minute window.
When lag starts climbing, the next step is figuring out where the delay begins.
request-latency-avg or record-error-rate on the producer side often points to network issues, ACL misconfigurations, or oversized batches.RequestQueueTimeMs on the broker side points to thread pool saturation.records-lag-max paired with a low records-consumed-rate usually points to a slow or stalled consumer, sometimes because of JVM GC pauses on the consumer side.For latency targets, aim for sub-50 ms produce latency with acks=1 and sub-200 ms with acks=all. For real-time processors, keeping lag under 1,000 messages is a solid baseline.
These signals only help if you turn them into clear baselines and alerts.
Kafka Monitoring: Noise vs. Signal - Alert Rules That Actually Work
Metrics matter when they lead to baselines, alerts, and tenant-level tracing. If they don't, you're just collecting numbers.
Start by watching normal load for 30 days. During that time, record p50, p95, and p99 for lag, throughput, and resource use.
Once those baselines are in place, define SLOs in time units, not message counts. That part matters more than it sounds. A lag of 100,000 messages could mean 1 second of delay for a high-throughput tenant, or 2 hours for a low-volume tenant. Those are two very different situations. A target like "99% of events processed within 60 seconds" gives on-call engineers something they can act on and ties straight to business impact.
| SLO Type | What It Measures | Implication for SaaS Teams |
|---|---|---|
| Freshness | Event-time to consume-time delay | Directly impacts real-time features like fraud detection or notifications. |
| Durability | Messages replicated to ISR | Ensures data isn't lost during broker failures; critical for billing and financial data. |
| Availability | Successful produce/fetch requests | Measures request success rate for tenant applications. |
| Volume | Expected vs. actual throughput | Detects silent producer failures or unexpected tenant traffic bursts. |
Each SLO should have an error budget. From there, use short- and long-window burn-rate alerts to manage it. That keeps the team focused on what users feel - like end-to-end latency breaches - instead of getting distracted by raw infrastructure swings.
Build alert rules from these SLOs, not the other way around.
A common mistake is alerting on infrastructure causes instead of symptoms. That's how teams end up with a noisy pager and low trust in alerts. For example, an under-replicated partition that lasts 5 minutes points to an actual problem. A raw host metric often doesn't.
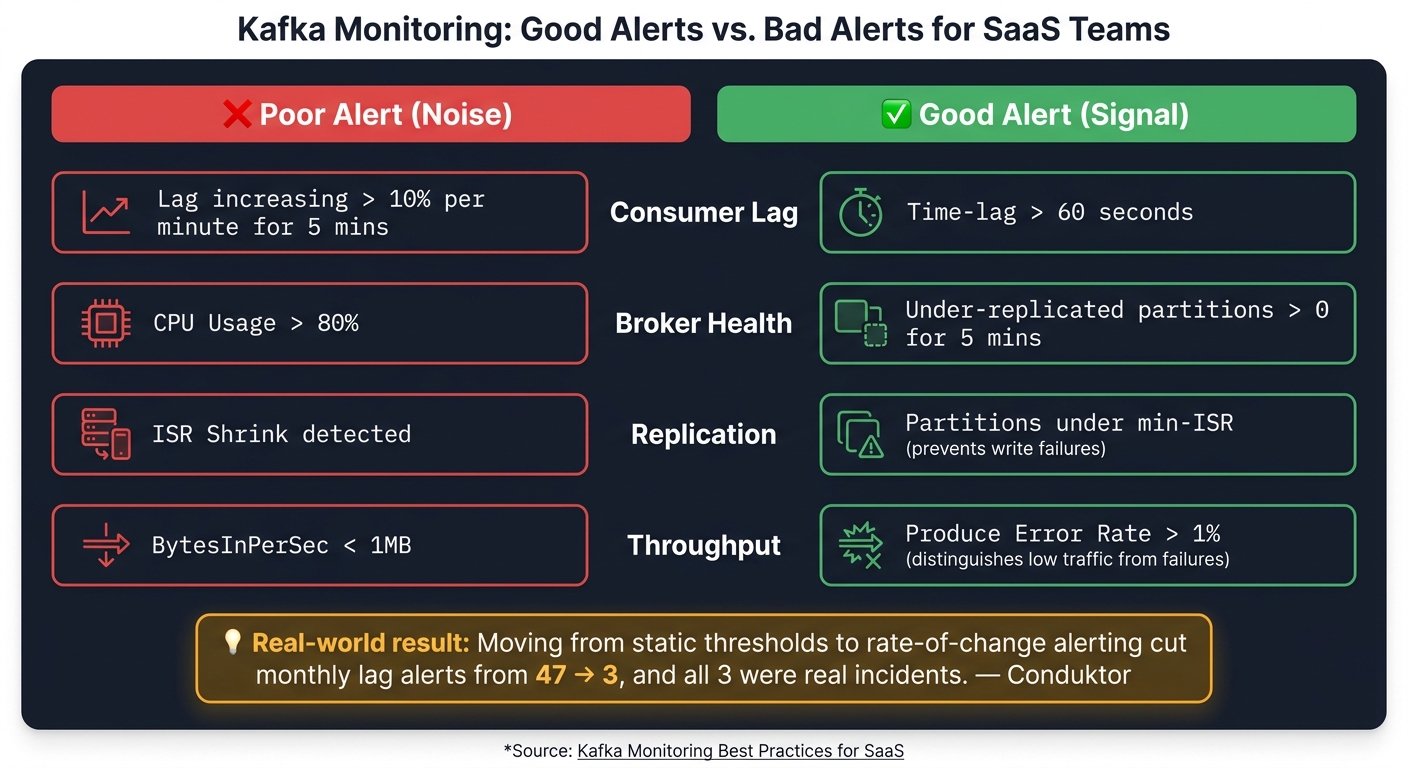
Conduktor reported cutting monthly lag alerts from 47 down to 3, and all 3 were real incidents, after moving from static thresholds to rate-of-change alerting. That's a huge shift. It means people stop ignoring alerts and start taking them seriously.
| Alert Rule Type | Poor Alert (Noise) | Good Alert (Signal) |
|---|---|---|
| Consumer Lag | Lag increasing > 10% per minute for 5 mins |
Time-lag > 60s |
| Broker Health | CPU Usage > 80% |
Under-replicated partitions > 0 for 5 mins |
| Replication | ISR Shrink detected |
Partitions under min-ISR (prevents write failures) |
| Throughput | BytesInPerSec < 1MB |
Produce Error Rate > 1% (distinguishes low traffic from failures) |
It helps to use three alert tiers:
ActiveControllerCount != 1Send platform-level alerts to the SRE team. Send consumer lag alerts to the application team that owns that consumer group.
Cluster alerts tell you that something failed. Tenant-aware tracing tells you who felt it.
A clean-looking broker dashboard can still miss the real issue. For instance, a producer leak can burn through heap and stall event flow before the broker dashboard shows anything obvious.
That's why end-to-end tracing matters. Inject W3C traceparent headers into Kafka messages with OpenTelemetry at the producer level. Then have consumers extract those headers and create child spans. That gives you message dwell time - the actual gap between production and consumption. At scale, teams also count messages at each hop, from proxy to consumer, to spot loss, duplication, and dwell time that broker metrics alone won't show.
For multi-tenant SaaS, standardize correlation fields like tenant_id, account_id, topic, and partition across services. That way, during an incident, you can filter logs and traces for one customer instead of digging through the whole system. In practice, one noisy tenant can blur the blast radius unless metrics are tagged by tenant.
A few checks go a long way here. Watch per-partition lag to catch hotspots from uneven key distribution. Track quota breaches so you can spot noisy neighbor tenants before they saturate shared brokers. In multi-region setups, monitor MirrorMaker 2 heartbeat signals and replication lag to make sure cross-region consistency stays inside your freshness SLO.
Then connect Kafka signals to business outcomes. A lag spike that looks small on a broker dashboard can still delay invoices or cause missed notifications for paying customers. That business context is what makes the monitoring strategy useful to the SaaS team that has to own the impact.
Once baselines and alerts are set, the next job is to make telemetry collection consistent and assign clear ownership.
Use the Prometheus JMX Exporter as a broker-side Java agent so MBean metrics are exposed to Prometheus. Consumer lag has to be collected another way because JMX doesn’t expose it directly. Add kafka-exporter or Burrow to poll the AdminClient API and surface records-lag-max and EstimatedTimeLag.
Build views at the cluster, topic, and partition levels. Cluster rollups can smooth over problem spots. By contrast, per-topic or per-tenant stacked charts make skewed keys and noisy neighbors much easier to spot.
Standardize tenant, environment, service, and region labels across metrics, logs, and traces. If those labels drift, incident triage turns into a hunt across the whole stack. For KRaft clusters, swap ZooKeeper-based signals for kafka.server:type=raft-metrics and watch commit-latency-avg and MetadataLoaderIdleRatio.
| Metric Category | Key Signal | Recommended Visualization |
|---|---|---|
| Broker Health | UnderReplicatedPartitions, RequestHandlerAvgIdlePercent |
Single stat (health) + gauge (saturation) |
| Topic Throughput | BytesInPerSec, MessagesInPerSec |
Time-series stacked by topic/tenant |
| Partition Balance | LeaderCount per broker |
Bar chart across nodes |
| Consumer Lag | records-lag-max, EstimatedTimeLag |
Heatmap by consumer group |
| End-to-End Latency | OTel messaging.kafka.message.offset spans |
p99 latency trend line |
After telemetry is standardized, the operating model shapes how much of the cluster your team can see.
Managed Kafka cuts operational work, but you give up visibility into JMX internals, OS disk I/O, and page cache metrics. To fill those blind spots, lean on client-side signals like producer retries and consumer poll intervals, then export provider telemetry into Prometheus or Datadog.
Self-managed Kafka on EC2 or Kubernetes gives you full access to JMX, OS metrics, and JVM internals. But there’s no free lunch: your team also owns upgrades, rebalancing, and hardware failures. BYOC lands in the middle. The vendor runs the control plane, while the customer keeps the VPC and data residency.
| Visibility Level | Metric Granularity | Operational Overhead | Typical Use Case for SaaS |
|---|---|---|---|
| Managed (e.g., Confluent Cloud, MSK) | High-level service health; limited internal JVM/OS access | Low; provider handles patching and broker scaling | Standard SaaS backends where speed-to-market is prioritized |
| Self-Managed (on EC2/K8s) | Full access to JMX, OS, disk I/O, and page cache metrics | High; team manages upgrades, rebalancing, and hardware | High-scale or highly regulated SaaS (HIPAA/SOC 2) requiring deep audit trails |
| BYOC (Bring Your Own Cloud) | Shared; provider manages control plane, customer sees infra metrics | Medium; requires integration between provider and customer cloud accounts | Enterprise SaaS requiring data residency within their own VPC |
Visibility matters only if incidents leave behind a clear trail and point people to the next step fast.
Centralize broker state changes, leader elections, authentication failures, ACL changes, and quota enforcement events in one log stream. In SOC 2 and HIPAA-regulated setups, those logs are part of the audit trail used to show access control and configuration integrity.
Keep security logs separate from operational logs. If tracing headers might contain PII, strip or hash them before logging, since observability tools often store them automatically.
Every high-priority alert should link to a runbook and the matching dashboard.
Put it all together, and one idea stands out: measure Kafka by user-visible freshness, not broker health alone. Kafka monitoring works best when labels, alerts, tenant views, and runbooks all use the same standard.
Start with the customer’s view of freshness and latency. A cluster dashboard can look healthy and still miss late customer workflows. That’s why it helps to measure consumer lag in time, not just offsets. Saying “fraud detection is 30 seconds behind” tells the story far better than a raw lag number. It ties Kafka signals straight to business promises.
SLOs make Kafka monitoring about something people outside the platform team can understand: how fast customers get their data. Recent outages have shown that producer-side failures can burn through heap and start rejecting traffic before broker dashboards show much trouble. Burn-rate alerts tied to user-visible impact bring those issues to light sooner.
After you have baselines and alerts set, automation and tracing help close the gaps that manual work tends to leave behind. Automate topic provisioning, enforce schema checks in CI/CD, and count events across producer, broker, and consumer paths. That end-to-end view makes it much easier to spot where data is slowing down or getting lost.
The practical path is pretty simple:
Measure Kafka lag in time, not just message counts. A time-lag metric like EstimatedTimeLag or an OffsetLag pair tells you how far a consumer group is behind in seconds or minutes.
If your tool doesn’t show time lag directly, you can work it out with now - message_timestamp for the message at the committed offset. That gives you the delay between the latest produced message and what the consumer group has already processed.
When you set alerts, focus on the worst-case group delay. For example, alert on max_lag_seconds instead of raw message totals. Message counts can be misleading, especially when traffic swings up and down during the day.
Page only for critical failures that affect durability, availability, or immediate service-level objectives.
For under-replicated partitions, use a delayed threshold, such as five minutes. That helps you avoid paging people for brief blips that clear on their own.
For consumer lag, alert on time-based lag or on steady growth that puts your SLAs at risk.
Use a hierarchical topic naming pattern, like tenant-name.topic-name, so you can group metrics and apply settings in a consistent way.
With Prometheus and Grafana, you can roll up tenant-labeled Kafka JMX metrics for throughput, latency, and consumer lag. Kafka doesn’t export disk usage per tenant out of the box, so you’ll need to run periodic scripts that calculate storage by tenant and push those numbers into your monitoring system. It also helps to set per-principal Kafka quotas to limit noisy neighbors.
Discover how metric trees can enhance business performance by breaking down high-level goals into actionable sub-metrics for better decision-making...
Discover 9 essential metrics to measure the success of your personalization efforts and boost customer engagement and revenue. personalization...
Explore the fundamental differences between Kafka and Pulsar regarding architecture, performance, and use cases to determine the right fit for your...