.jpeg)
.png)
Overview
VAMA is a comprehensive platform offering spiritual services, encompassing diverse topics such as tarot card reading, numerology, and relationship advice. Over the course of seven events, VAMA has aimed to connect with a wide audience seeking spiritual guidance and insight. With a total of 4500+ unique attendees across these events, VAMA has focused on leveraging digital platforms to expand its reach and enhance engagement.
Problem
As Vama scaled its offerings, several challenges emerged:
- Disjointed Customer Journey Data: Data from web, app, and offline channels existed in silos, making it difficult to track and analyze customer journeys comprehensively.
- Overcomplicated Event Tracking: With over 270 events being tracked, redundant and overlapping events cluttered their analytics pipeline, leading to inefficiencies and high billing costs for data processing.
- Limited Insight into Business KPIs: The existing analytics setup lacked visibility into key metrics like conversions, retention, and engagement—critical for decision-making by Vama’s leadership team.
- Legacy Code Issues: The analytics codebase contained legacy implementations that created technical debt and slowed down the development of new features.
- Outdated Engagement Tool: Vama’s current customer engagement platform, WebEngage, was unable to support their growing needs for robust event tracking and deeper integrations with other tools like Mixpanel.
Objective :
- Building a unified customer view across the web, apps, and offline channels for better tracking of user journeys.
- Reducing redundant or overlapping events and consolidating event tracking to improve efficiency and reduce billing costs.
- Enhancing dashboard visibility for critical CXO-level KPIs, including revenue, user engagement, and retention metrics.
- Replacing WebEngage with a more comprehensive customer engagement platform, integrated seamlessly with Mixpanel and other tools.
- Cleaning up the analytics codebase by removing legacy tracking and adopting a scalable implementation framework.
- Establishing a server-side integration for mobile attribution data, enabling richer insights into customer acquisition and performance.
Solution
To address these challenges, the Vama team, with support from their analytics partner Optiblack, implemented the following solutions:
- Streamlined Event Tracking Pipeline
- Vama adopted a new analytics framework using RudderStack, an open-source customer data pipeline, to route events to analytics tools like Mixpanel and MoEngage.
- The number of tracked events was reduced from 270 to a more manageable 80 events, focusing on high-priority actions such as revenue events, signups, and service bookings.
- Enhanced Mixpanel Integration
- A new Mixpanel project was set up to replace the existing implementation, ensuring a clean slate for accurate data collection and analysis.
- Server-side integration was implemented to ingest mobile attribution data directly into Mixpanel, providing a comprehensive view of marketing performance.
- Improved CXO Dashboards
- Custom dashboards were created in Mixpanel to highlight key KPIs like conversion rates, retention cohorts, and revenue from new users.
- Daily reports were automated to track metrics such as Return on Ad Spend (ROAS) and user acquisition performance.
- Migration to MoEngage
- Vama replaced WebEngage with MoEngage as their customer engagement platform, enabling more robust campaign management and integration with analytics tools.
- MoEngage's visual journey builder was leveraged to create and optimize multi-channel user journeys.
- Codebase Optimization
- Legacy analytics code was removed, and event tracking was standardized to follow a structured format.
- Events were redesigned to include nested properties, reducing redundancy and improving data quality for analysis.
- Data-Driven Decision Making
- Marketing and product teams collaborated to define actionable insights from the dashboards, enabling faster iteration on campaigns and feature development.
- Historical data discrepancies were resolved, ensuring consistency across backend systems and analytics tools.
Impact
The implementation of the new analytics infrastructure delivered significant business impact for Vama:
- Cost Savings: By consolidating events and optimizing their data pipeline with RudderStack, Vama reduced their data processing costs by 30%.
- Improved Decision Making: The new CXO dashboards provided real-time insights into key metrics, helping leadership make data-driven decisions.
- Increased Efficiency: Legacy analytics code cleanup reduced technical debt, accelerating the release of new features by 20%.
- Enhanced Marketing Attribution: With server-side attribution integration, Vama gained clarity on their most effective marketing channels, enabling better allocation of ad spend.
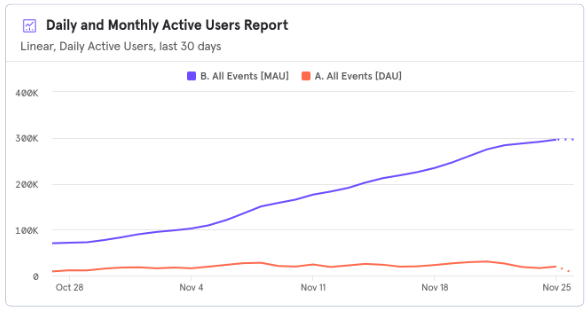
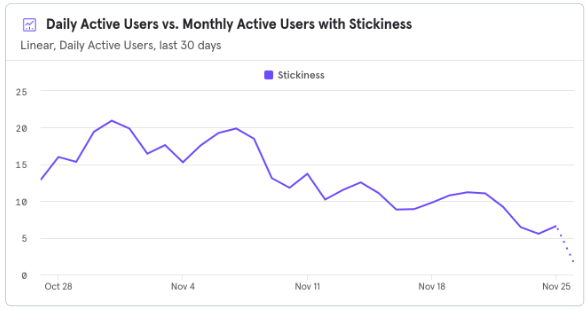
- User Engagement Growth: Personalized multi-channel campaigns built on MoEngage drove a 15% increase in user retention and a 20% lift in daily active users (DAUs).
- Scalability: The optimized event tracking setup provided a scalable foundation to support Vama’s rapid growth, including plans to expand their spiritual services portfolio.
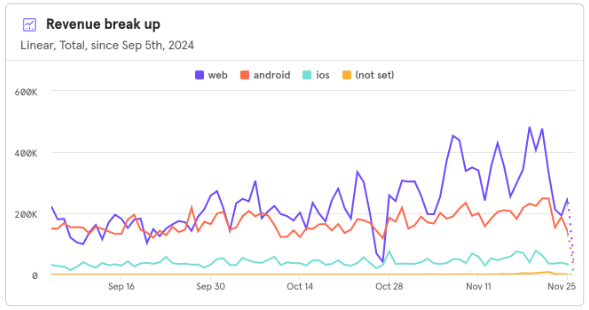
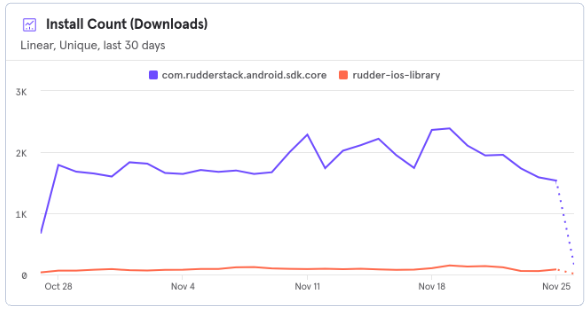
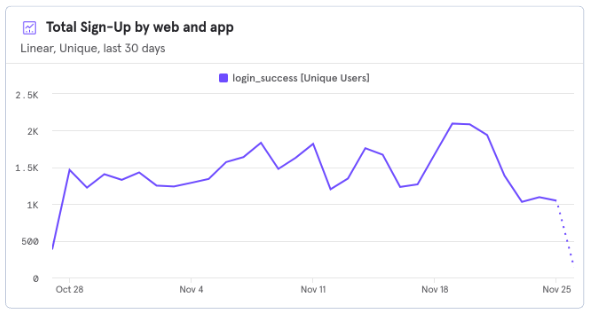
Dashboad/Reports
The following reports were key to Vama’s success:
- Funnels: Conversion funnels tracking user flows from service discovery to booking completion.
- Retention: Cohort analysis to measure user retention and repeat bookings over time.
- Insights: Granular breakdowns of revenue, user acquisition, and engagement metrics, with daily automated email updates.
- Return on Ad Spend (ROAS): Performance tracking for marketing campaigns, with data segmented by channels and geographies.


Setting up the CDP Rudderstack to manage the data


Dashboards & Reports


Vama’s transformation in analytics infrastructure has not only streamlined their operations but also empowered their teams to focus on what matters most: delivering meaningful spiritual services to their users. With a robust foundation in place, Vama is well-positioned to scale its impact and become a leader in the spiritual tech industry.
-3.png)
-4.png)
-4.png)